Minitab Workspace 2
Ürünler
All the essential visual business tools in one place
Searching for simple solutions to achieve the greatest impact with your work and provide business value? Minitab Workspace enables you to move work forward with powerful visual tools, process maps, brainstorming diagrams and forms in one intuitive interface right at your finger tips. Our tools help form processes and identify opportunities, ultimately making problems easier to solve.
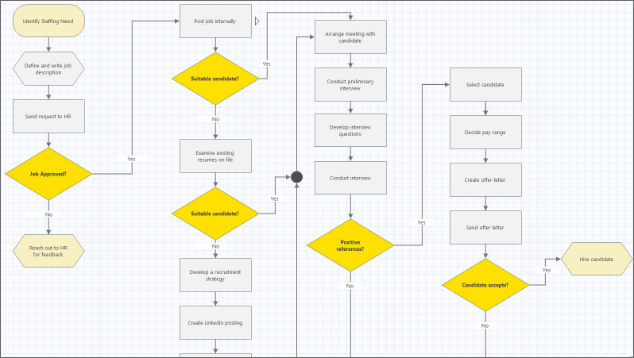
Process Map
Build flowcharts with ease to help understand, see and communicate all the activities in a process with the added ability to customize the level of detail necessary.
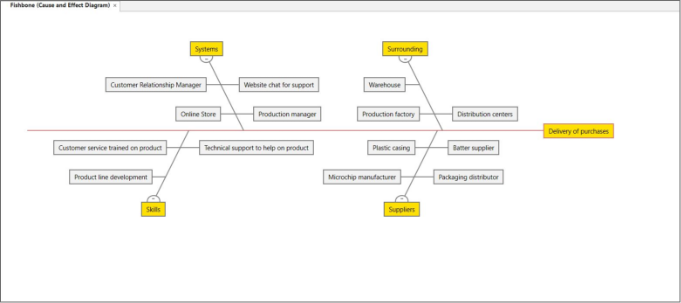
Fishbone
Map out and identify every relevant element for a holistic view of your processes or projects, regardless if they are simple or complex.
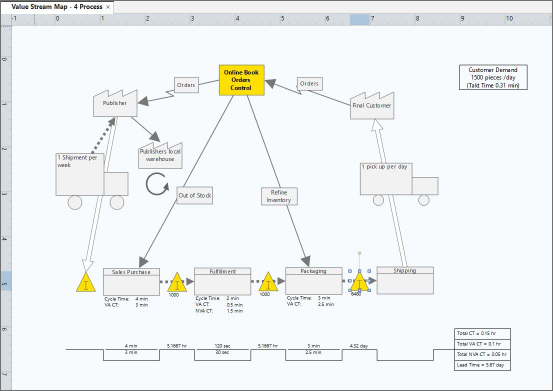
Value Stream Map
Visualize the flow of deliverables and information through your organization, department, or team and showcase the value it creates for your customers and stakeholders.
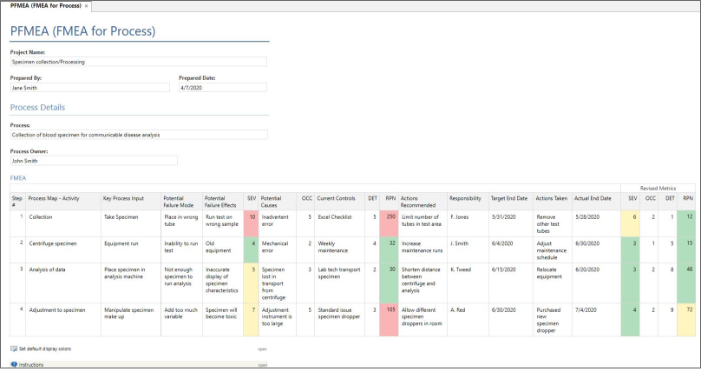
Failure Modes and Effects Analysis (FMEA)
Mitigate risk of failure in a process or product design by identifying potential failures and taking the actions needed to achieve projected goals.
Note: Workspace’s FMEA meets the latest AIAG-VDA Standards to ensure industry-leading standards for product and process development.
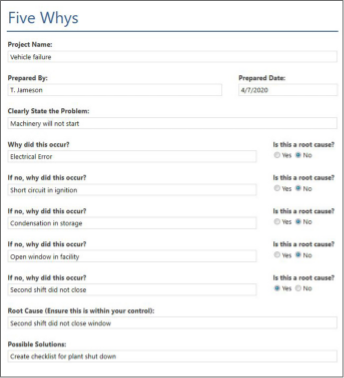
Five Whys
Determine the root cause of a problem through direct questions, relationship mapping and reflection to prevent recurrence in the future.
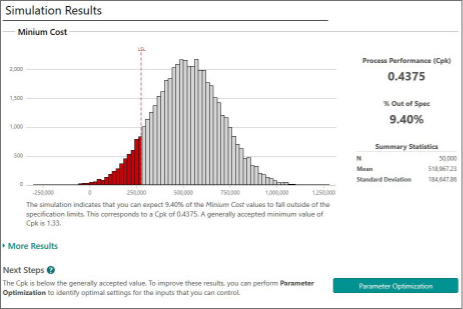
Monte Carlo Simulation
Evaluate and understand risk in a process or project, forecast the results, and optimize effortlessly with speed and efficiency.
Minitab Workspace™ Features
Forms
Formulas/equations
Conditional formatting
Customizable
Included forms:
- 30-60-90 Action Plan
- 5S Audit
- A3
- Activity (Shape) Lean Data
- Activity (Shape) Process Data
- Audit Plan
- Bar Chart Worksheet
- Blank Form
- C&E Matrix (X-Y Matrix)
- Control Plan
- Cycle Time Bar Chart
- Data Collection Plan
- Design Scorecard
- DFMEA
- DFMEA (Supports New AIAG-VDA Guidelines)
- Financial Data
- Five Whys
- Force Field
- Funnel Report
- Gantt Chart
- Gemba Walk Interview Sheet
- House of Quality Matrix
- Impact vs. Effort Matrix
- Kanban & Supermarket Sizing
- Kano Model
- Lean Metrics Comparison
- Line Balancing
- Meeting Minutes
- New Procedure Audit
- Pairwise Comparison Matrix
- Pareto Chart Worksheet
- PFMEA
- PFMEA (Supports New AIAG-VDA Guidelines)
- Preparation Checklist
- Preventative Maintenance
- Project Charter
- Project Prioritization Matrix
- Project Risk Assessment
- Project Today
- Pugh Matrix
- Quick Changeover (QCO-SMED)
- RACI (Responsibility Assignment Matrix)
- Scatterplot Worksheet
- SIPOC
- Solution Desirability Matrix
- Solution Implementation Checklist
- Stakeholder Analysis
- Standard Work Combination Chart
- SWOT Analysis
- Tasks
- Team Members & Roles
- TRIZ Technical Contradictions Matrix
- True North Metrics
- Value Stream Map Comparison
- Value Stream Map Shape Data
- Value-Added Flow Analysis
- VOC Plan
- VOC Summary
- Waste Analysis by Operation
- Work Element Time Study
- X Variables Data
- Y Metrics
- Y Variables Data
Mapping Tools
Process Maps (Flowchart, Process diagram) including:
- Cross Functional Process Maps
- Swimlanes
- Shape data: Inputs, outputs, defect rate, throughput yield, etc.
- Bunny hops
Value Stream Maps with:
- Takt time calculator
- Current vs. future state comparison
- Timeline with automatic cycle time calculations
Organizational Chart
Monte Carlo Simulation
Monte Carlo Simulation with:
- Parameter optimization
- Sensitivity analysis
- Import a model from Minitab
- Suggest a distribution based on data
Brainstorming
- Mind Map
- 4S
- 8P
- Fishbone (Cause and Effect Diagram)
- Man Machines Materials
- Idea Map
- CT Tree
Project Roadmaps
Customizable
Add phases, sub-phases, or folders to organize project tools and artifacts
Store related documents (e.g., spreadsheets, images, websites, presentations, Minitab project files) inside your project
Share data between tools (e.g., reuse input variables from your process map in your FMEA or C&E Matrix)
Included roadmaps:
- DMAIC (Define-Measure-Analyze-Improve-Control)
- CDOV (Concept-Design-Optimize-Verify)
- QFD (Quality Functional Deployment)
- Kaizen Event
- PDCA (Plan-Do-Check-Act)
- Just Do It
Analysis Capture Tools
Tools for guiding and documenting statistical analysis:
- 1-Sample Hypothesis Test Capture
- 2-Sample Hypothesis Test Capture
- ANOVA Capture
- Attribute Agreement Analysis Capture
- Binary Logistic Regression Analysis Capture
- Blank Analysis Capture
- Capability Analysis Capture
- Capability Analysis (Attribute) Capture
- Chi-Square Test Capture
- Control Chart Capture
- DOE Analysis Capture
- DOE Planning Capture
- Equal Variances Test Capture
- Gage Linearity & Bias Study Capture
- Gage R&R Study Capture
- Graph Your Data
- Kruskal-Wallis Test Capture
- Normality Test Capture
- Regression Analysis Capture
To get information for Licensing and Pricing, please contact us by sending an e-mail to [email protected] or by dialling +90 312 210 13 44.”