Minitab
Products
Better decision making.
Faster performance.
Easier than ever.
Now with CART®
Anywhere on the Cloud
Minitab delivers statistical analysis, visualizations, predictive and improvement analytics to enable data-driven decision making. Regardless of statistical background, Minitab can empower an organization to predict better outcomes, design better products and improve the future through its easy-to-use software or support network of expert statisticians.
Better
Our newest features empower users with better decision-making capabilities for both the seasoned user or new users of our software.
Faster
Faster performance to synthesize larger amounts of data with ease. Discover valuable insights in your data, faster.
Easier
Easier than ever. A new intuitive interface and Minitab’s Assistant are able to easily guide you through your data analysis. Industry-leading technical support and training are available to help you along the way.
Improvements
Better Decisions
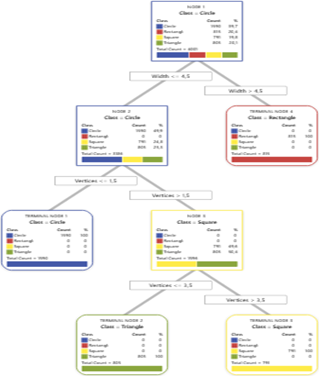
Unlock better decision-making from everywhere with Minitab available in both the trusted desktop application you know and love, and our new cloud-enabled web app. Expand your insights to be better informed and proactive in your industry with the unparalleled power of statistics in Minitab, including our popular predictive analytics tool, Classification and Regression Trees (CART®).
Interface Improvement: Multi-Select in the Navigator
Ability to select multiple items from the Navigator that was introduced in Minitab 19.1. Selecting a range of output makes it easier for users who need to remove or send output from the Navigator.
with the unparalleled power of statistics in Minitab, including our popular predictive analytics tool, Classification and Regression Trees (CART®).
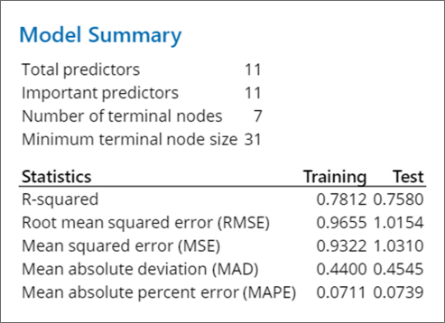
Creating Faster and Safer Models with Validation
Evaluate the accuracy of your regression models with the validation option quickly. Effortlessly resample or segment your data by test and training sets, then evaluate the predictive accuracy of your model faster than ever. It Includes Regression, Binary Logistic Regression and Poisson Regression.
Easier Integration
With Python’s open source integration, combine your scripts with your Minitab data and analyze them easily in Minitab Statistics Software. Increase your analysis in the interface or in a macro and take advantage of further exploration. Easily collaborate with data scientists with Minitab to solve even more problems.

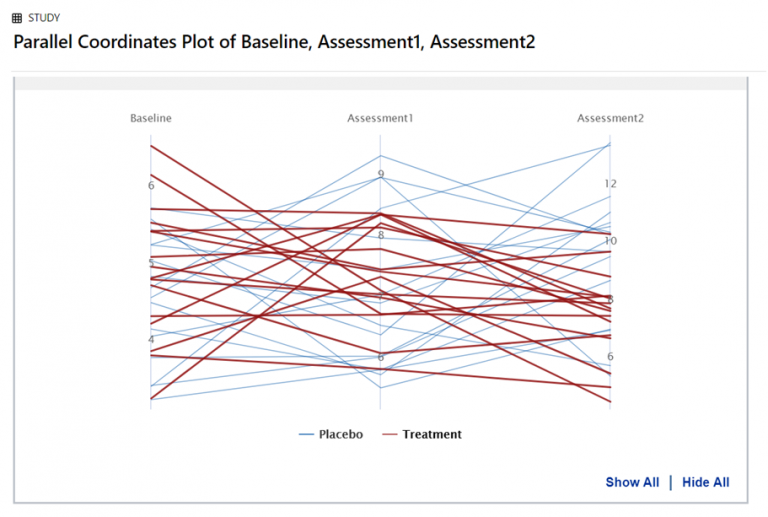
New Visualizations: Parallel Coordinates Plot
A parallel coordinates plot is a graph that displays multivariate numerical data, making it easy to visualize multiple dimensions.
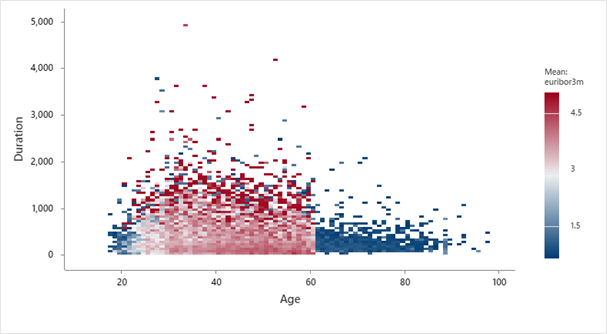
New Visualizations: Binned Scatterplot
A binned scatterplot is a visual to display the relationship between two continuous variables when the dataset contains many observations. The gradient can be defined by observation frequency or by the mean of another variable.
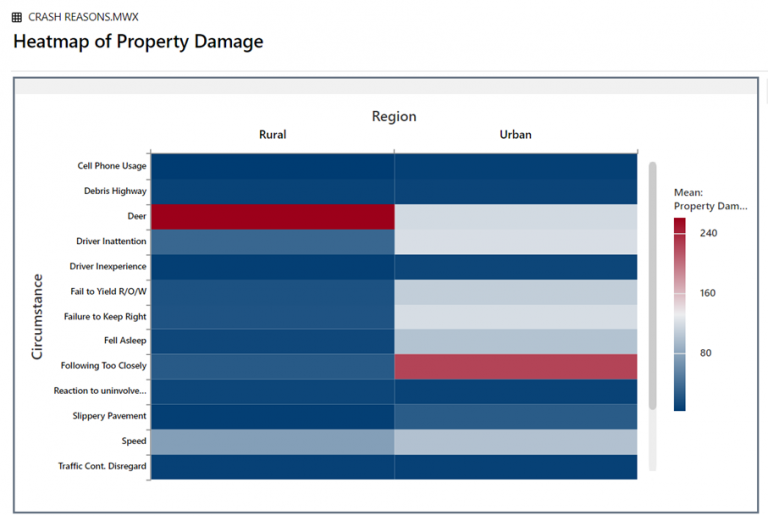
New Visualizations: Heat Map
A heatmap is a visual to display the impact of multiple categorical variables on a metric. The multiple categorical variables are displayed in a table layout with a gradient to display a function of a metric (e.g., percent defects, average customer satisfaction rating).
Update: Report
A Report within a Minitab project.
Create and view reports directly within
your Minitab Project file, making it easy to organize results. Reports are customizable and support the aggregation and curation of live-linked Minitab tables and graphs. Users can also add annotations to a Report.
A better interface
The Minitab environment was improved to make results creation, navigation and management easier and faster than in previous versions.
Output Pane
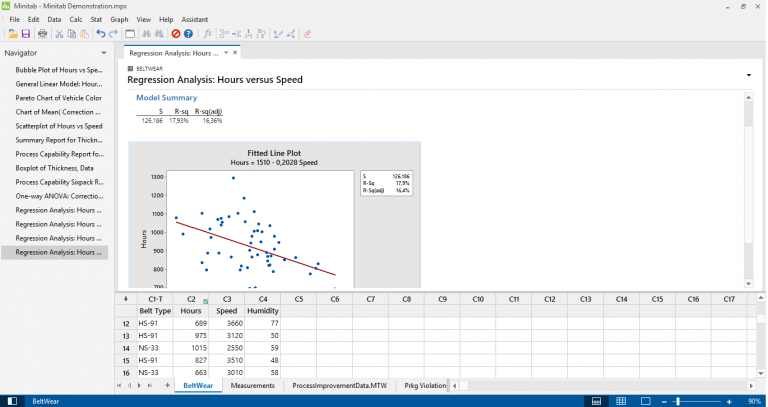
The Output pane contains statistical and graphical results, replacing the Session window of previous releases. Graphs that are created with a command are displayed with the results, rather than a separate window as in previous releases. Each command will have its own page, making it easier to find and interact with results. Output contains the name of the worksheet at the top (in this view, Beltwear):
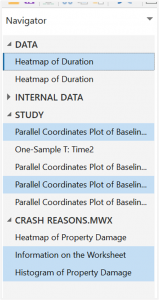
Navigator
The Navigator contains all command output and is shown by default. It can be toggled on/off on the left side of the status bar (across the bottom of the application) and through the View menu.
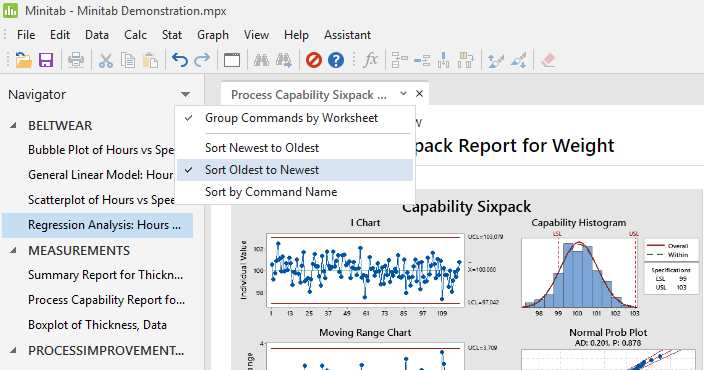
The drop-down menu allows you to sort and group by worksheet
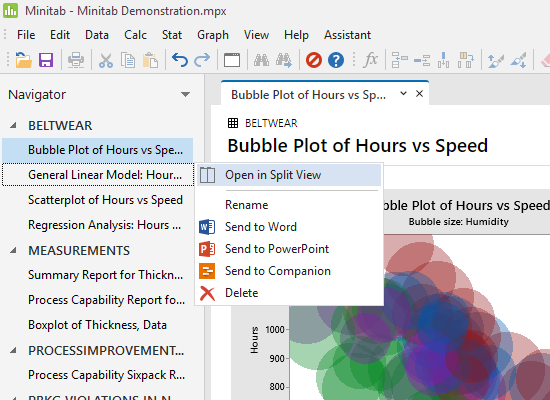
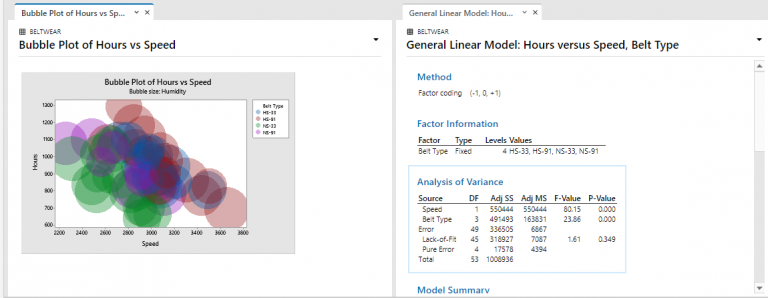
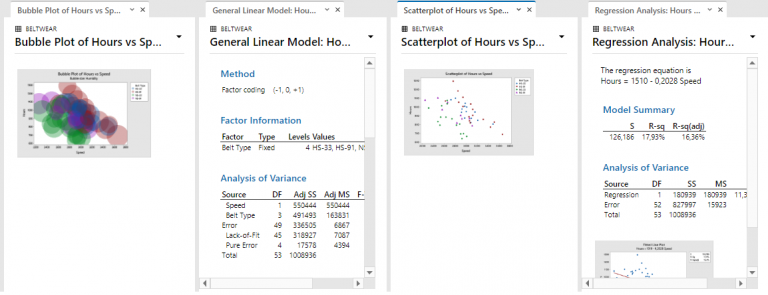
Split View: Comparing Results
Easily compare results by right mouse clicking on an item in the navigator and open in split view:
Worksheets/Data
In Minitab, all data resides in worksheets. Worksheets now reside in tabs along the bottom of the application. The view can be toggled on/off using the right side of the status bar or using the View menu.
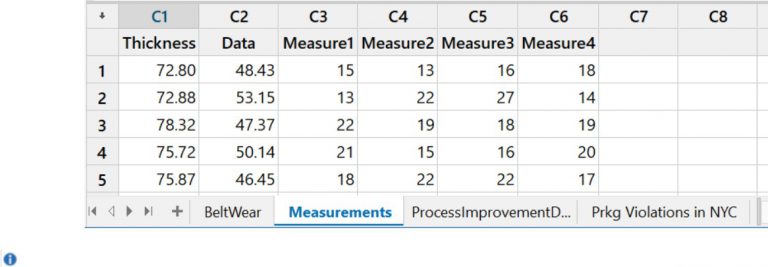
Worksheet Information is located under the Data menu or if you right mouse click the worksheet tab.
Menus/Toolbars
The Editor, Tools and Window menus were removed. Functionality was rearranged to improve discoverability and usability.
File menu additions: Each of these are now located under File menu:
- Options
- Related Documents Manage Profiles File Security
- Run an Exec
The View menu has been added:
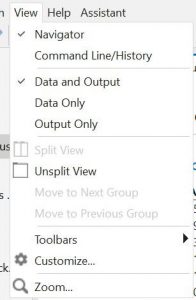
Toolbars, Zoom and Customize functionality now reside in the View menu.
The Status Bar at the bottom of the application makes it easy to toggle views of the Navigator (left), Output Pane & Worksheets view, Worksheets only view or Output only view. Zoom for output is also easier.
Status bar:
Command Line/History
The Release 19 Command Line/History pane replaces the Release 18 Command Line, Command Line Editor and History window. View-Command Line/History

Statistical Features
Design of Experiments: Analyze Binary Response
Analyze binary responses is now available in the Screening, Factorial and Response Surface platforms. A major advantage is that it will allow for joint optimization of continuous and binary responses.
Quality Tools: Normal Capability Analysis
The Normal Capability Analysis commands (Normal, Between/Within, Multiple Variables (Normal) have had the following updates:
- Provide Upper Confidence Limits in addition to Lower Confidence Limits of
- Provide Confidence intervals for Expected Overall PPM < LSL, PPM > USL, PPM
- Provide Confidence intervals for Expected Within PPM < LSL, PPM > USL, PPM Total (For CAPA and MCAPA commands only).
- Provide Confidence intervals for Expected B/W PPM < LSL, PPM > USL, PPM Total (For BWCAPA and MCAPA commands only).
- Allowed Two-sided and One-sided options for Confidence
- Added a global option to display PPM or Percent, and to display confidence
Dialog changes
In the File-Options sub dialog, the options for Confidence intervals changed from Two-sided, Lower Bound, Upper Bound to One-sided (default) and Two-sided.
Modeling:
Provide modern criterion (AICc and BIC) to reduce models
Using p-values as stopping rules for forward selection, backward elimination, and stepwise model selection is losing favor in the statistical community. Criterion-based methods, such as minimizing AICc or BIC have become standard both in academia and in practice.
Regression: Add Pareto Chart to Fit Regression Model
A Pareto plot of effects has been added to Regression and made accessible through the Graphs sub dialog.
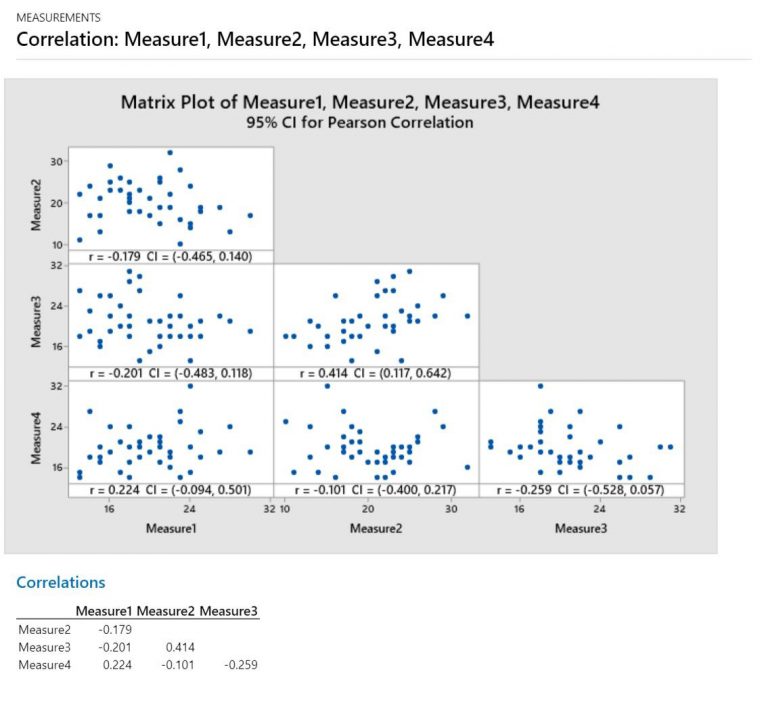
Basic Statistics: Correlation now includes matrix plot to visualize data
Now available in 64 bit
Minitab Statistical software is available in 64-bit versions.
- File Extensions/Backwards compatibility
- Minitab Statistical Software projects have the .mpx extension. Minitab Statistical Software worksheets have a mwx.
- Minitab Statistical Software can open Minitab 16 and beyond Minitab version Project files.
- Minitab Statistical Software can open Minitab 16 and beyond Minitab version Worksheet files.
- Minitab Statistical Software can be saved as .xlsx, .xls, .xml, text(ANSI), text(Unicode), text(UTF-8), CSV(ANSI), CSV(Unicode) and CSV(UTF-8).
Calc-Resampling
The Bootstrapping and Resampling commands existed in Express and will be implemented in Minitab Statistical Software with the release of 19.1.
Licenses
To get information for Licensing and Pricing, please contact us by sending an e-mail to [email protected] or by dialling +90 312 210 13 44.
Commercial Licenses
According to the usage period, The license options of Minitab 19 Statistical Quality Software are ”ANNUAL“ and “PERPETUAL” as follows:
ANNUAL Licenses
Multi User License – MUL
Perpetual Licenses
Single User License – SUL
Perpetual Simultaneous License – PSL
- Time of use is 1 year. If you want to continue to use, you have to buy annual license again.
- Saleable in multi-user packages with 5, 10, 15, 20, 30 users and more. There is no other annual license package other than this License type.
- UPGRADE for new versions is FREE (e.g. to Minitab 20).
- Minitab can be install all computers in a network. Number of users that can use Minitab 18 at the same time will be as many users in the package you purchased. (Floating License)
- Licenses in the license package can be distributed to any number of network users and individual users (PCs or laptops). (For example: You can distribute a 10-user multi-license package to be 4 individual users with no network connection and 6 network users. You can also distribute your licenses to 10 individual users or 10 network users.)
- Free technical support is provided for 1 year.
- It runs on all 32-bit and 64-bit Windows platforms (Windows 7, Windows 8, 8.1, Windows 10, Windows Server).
- The duration of use is unlimited. You can use it for lifetime.
- It can be sold in individual licenses. You need to get a license for each computer.
- They cannot be opened to public use on the network nor they cannot be used as a floating license.
- Free technical support is provided until 1 year after the new version is released.
- Upgrading to new versions is optional and charged (e.g. to Minitab 20).
- It runs on all 32-bit and 64-bit Windows platforms (Windows 7, Windows 8, 8.1, Windows 10, Windows Server).
- The duration of use is unlimited. You can use it for lifetime.
- Saleable in multi-user packages with 5, 10, 15, 20, 30 users and more.
- Minitab can be install all computers in a network. Number of users that can use Minitab 19 at the same time will be as many users in the package you purchased. (Floating License)
- Licenses in the license package can be distributed to any number of network users and individual users (PCs or laptops). (For example: You can distribute a 10-user multi-license package to be 4 individual users with no network connection and 6 network users. You can also distribute your licenses to 10 individual users or 10 network users.)
- Free technical support is provided until 1 year after the new version is released.
- Upgrading to new versions is optional and charged (e.g. to Minitab 20). The upgrade price is 50% of the current license price (80% in academic licenses).
- It runs on all 32-bit and 64-bit Windows platforms (Windows 7, Windows 8, 8.1, Windows 10, Windows Server).
Academic Licenses
Minitab 19 is the latest version of the Minitab Statistical Quality software. Academic software can only be used in universities and institutes for educational purposes. Licenses are made to the authorities having the e-mail address “edu.tr”. According to the usage period, The license options of Minitab 19 Statistical Quality Software are ”ANNUAL“ and “PERPETUAL” as follows:
ANNUAL Licenses
Multi User License – MUL
Perpetual Licenses
Single User License – SUL
Perpetual Simultaneous License – PSL
- Time of use is 1 year. If you want to continue to use you have to buy annual licence again.
- Saleable in multi-user packages with 5, 10, 15, 25, 35 users and more. There is no other annual license package other than this License type.
- UPGRADE for new versions is FREE (e.g. to Minitab 20).
- Minitab can be install all computers in a network. Number of users that can use Minitab 18 at the same time will be as many users in the package you purchased. (Floating License)
- Licenses in the license package can be distributed to any number of network users and individual users (PCs or laptops). (For example: You can distribute a 10-user multi-license package to be 4 individual users with no network connection and 6 network users. You can also distribute your licenses to 10 individual users or 10 network users.)
- Free technical support is provided for 1 year.
- It runs on all 32-bit and 64-bit Windows platforms (Windows 7, Windows 8, 8.1, Windows 10, Windows Server).
- The duration of use is unlimited. You can use it for lifetime.
- It can be sold in individual licenses. You need to get a license for each computer.
- They cannot be opened to public use on the network nor they cannot be used as a floating license.
- Free technical support is provided until 1 year after the new version is released.
- Upgrading to new versions is optional and charged (e.g. to Minitab 20).
- It runs on all 32-bit and 64-bit Windows platforms (Windows 7, Windows 8, 8.1, Windows 10, Windows Server).
- The duration of use is unlimited. You can use it for lifetime.
- Saleable in multi-user packages with 5, 10, 15, 25, 35 users and more.
- Minitab can be install all computers in a network. Number of users that can use Minitab 19 at the same time will be as many users in the package you purchased. (Floating License)
- Licenses in the license package can be distributed to any number of network users and individual users (PCs or laptops). (For example: You can distribute a 10-user multi-license package to be 4 individual users with no network connection and 6 network users. You can also distribute your licenses to 10 individual users or 10 network users.)
- Free technical support is provided until 1 year after the new version is released.
- Upgrading to new versions is optional and charged (e.g. to Minitab 20). The upgrade price is 80% of the current license price.
- It runs on all 32-bit and 64-bit Windows platforms (Windows 7, Windows 8, 8.1, Windows 10, Windows Server).